

-
 Cart
1
Cart
1


Registering for this site is easy. Just fill in the fields below, and we'll get a new account set up for you in no time.

Sign in to your One Education account
Excel Crash Course
Excel Crash Course
PRIVATE
PRIVATE COURSE OR


 1 Year Access
  Intermediate
 0 Students
 -
 2 hours, 48 minutes
Course Curriculum
| Analysis of Twitter Dataset and Designing Heatmaps | |||
| Introduction to the Excel crash course | 00:06:00 | ||
| Understanding the Twitter Dataset | 00:05:00 | ||
| Extracting Other Details for Analysis | 00:09:00 | ||
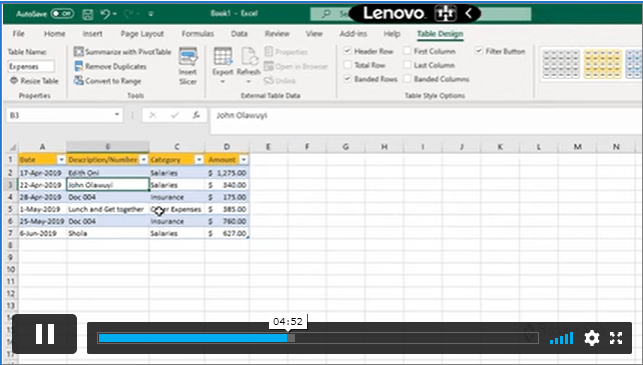
| Creating Pivot Tables | 00:08:00 | ||
| Applying Conditional Formatting using Color Scales | 00:03:00 | ||
| Adding Slicers to Dashboard | 00:02:00 | ||
| Applying Custom Number Formats | 00:03:00 | ||
| Adding Custom Images to Charts | 00:11:00 | ||
| Interlude – Data Manipulation Challenge | 00:02:00 | ||
| Adding Heatmap Legend | 00:02:00 | ||
| Wrapping Up – Introduction to Open Analytics | 00:02:00 | ||
| Advanced Currency Converter using Dynamic Arrays | |||
| Introduction to Modern Excel Tables and Dynamic Arrays | 00:11:00 | ||
| Using Power Query for Data Manipulation | 00:08:00 | ||
| Applying Power Query Data Transformations | 00:06:00 | ||
| Structured Table Referencing | 00:12:00 | ||
| XLOOKUP Function and Pivot Table Calculations | 00:05:00 | ||
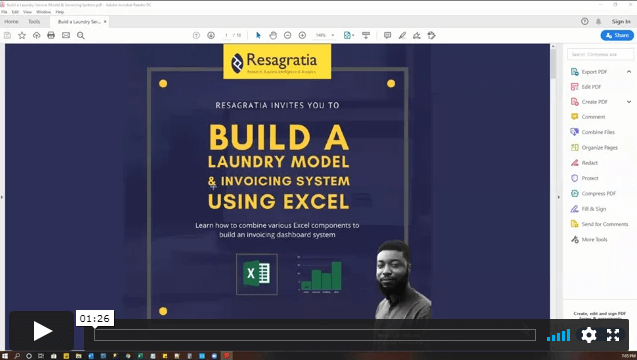
| Laundry Service Model and Invoicing Dashboard | |||
| Introduction to the Project | 00:01:00 | ||
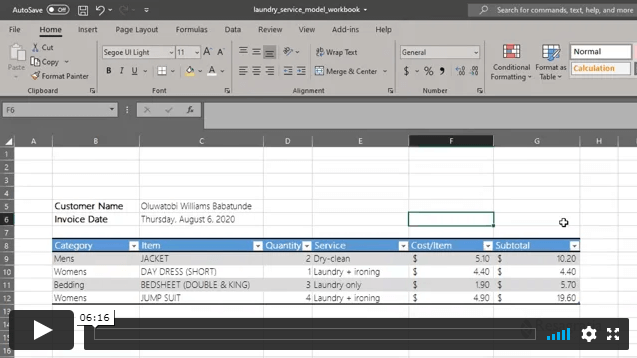
| Overview of the Laundry Model Project | 00:04:00 | ||
| Understanding the Inputs | 00:03:00 | ||
| Formatting the Input Tables | 00:04:00 | ||
| Duplicate and Combine Tables with Power Query | 00:09:00 | ||
| Rounding Digits in Power Query | 00:02:00 | ||
| Load Specific Tables from Power Query | 00:02:00 | ||
| Feature Extraction and Named Ranges | 00:10:00 | ||
| Combining Elements – Data Validation with Named Ranges | 00:08:00 | ||
| Combining Elements – Understanding the INDIRECT Function | 00:02:00 | ||
| Combining Elements – Dynamic Drop-down Menu with Data Validation | 00:04:00 | ||
| Combining Elements – INDEX and MATCH with Multiple Criteria | 00:12:00 | ||
| Understanding the MATCH Formula with Multiple Criteria | 00:06:00 | ||
| Business Invoice Dashboard Design | 00:06:00 | ||

Related Courses

Intermediate

Intermediate

Intermediate
COPYRIGHT © 2022 One Education
1
- Item added to cart
1
Your Cart

Gain Access To All Courses For A Year
Qty: 1
Other Students Also Buy
-
 Get Lifetime Access To Your Course£9.99 Add to basket+Add