

-
 Cart
1
Cart
1


Registering for this site is easy. Just fill in the fields below, and we'll get a new account set up for you in no time.

Sign in to your One Education account
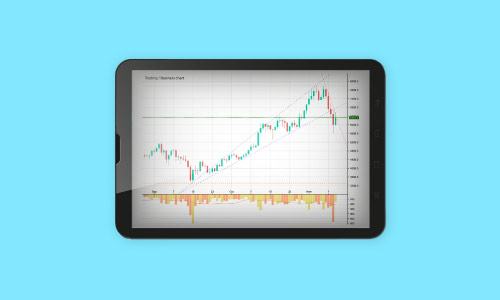
Stock Market Chart Patterns for Day Trading
Stock Market Chart Patterns for Day Trading
£29 ex Vat
Take This Course OR


 1 Year Access
  Intermediate
 232 Students
 -
 1 hour, 29 minutes
Course Curriculum
| Course Name: Stock Market Chart Patterns for Day Trading | |||
| Introduction | 00:02:00 | ||
| Module 01: Support and Resistance | 00:05:00 | ||
| Module 02: Trendlines | 00:04:00 | ||
| Module 03: Head and Shoulders: H&S Pattern | 00:06:00 | ||
| Module 04: Inverse Head and Shoulders Pattern: IH&S | 00:02:00 | ||
| Module 05: Bull Flag | 00:03:00 | ||
| Module 06: Bear Flag | 00:03:00 | ||
| Module 07: ABCD Pattern | 00:05:00 | ||
| Module 08: Live Examples and Market Analysis | 00:18:00 | ||
| Module 09: Pattern Practice | 00:04:00 | ||
| Module 10: Trading Platform Setup | 00:30:00 | ||
| Module 11: Risk Free Trading Practice | 00:07:00 | ||
| Assignment | |||
| Assignment -Stock Market Chart Patterns for Day Trading | 00:00:00 | ||

Related Courses

Intermediate

Intermediate

Intermediate
COPYRIGHT © 2022 One Education
1
- Item added to cart
1
Your Cart

Gain Access To All Courses For A Year
Qty: 1
Other Students Also Buy
-
 Get Lifetime Access To Your Course£9.99 Add to basket+Add