Getting Results with PowerBI

  • Bestseller
  • Great Service
  • Highly Rated
  • Trending

Develop practical data analysis skills with Getting Results with PowerBI, learning how to visualise data, create interactive dashboards, interpret insights, and support smarter business decisions using modern Power BI reporting tools.

Getting Results with PowerBI

Get access to 5000+ courses including this for only £49. Learn More.

Overview of Getting Results with PowerBI

Getting Results with Power BI is a practical course designed to build strong Business Intelligence skills. You will learn Power BI fundamentals, Data Visualization, and Dashboards while transforming raw data into meaningful Insights using Reports, Analytics, KPIs, and essential Data Modeling concepts.

This course covers hands-on modules including data import, visual creation, slicers, combo charts, Power Query transformations, map visuals, and decomposition trees. You will strengthen DAX calculations and Data Modeling techniques to build interactive Dashboards and high-impact Business Intelligence Reports for better decision making and performance tracking.

By the end of Getting Results with Power BI, you will be able to create advanced Dashboards, track KPIs, and generate actionable Insights. This Business Intelligence course helps you apply Analytics, DAX, and Data Visualization to solve real-world data problems effectively.

The course was audited and updated on: 4th April, 2026

Learning Outcomes of Getting Results with PowerBI

Method Of Assessment​

Learners complete an assignment designed to evaluate their understanding of the course content. The assignment is reviewed by qualified tutors who provide personalised feedback, allowing learners to demonstrate their applied knowledge and skills.

Certification

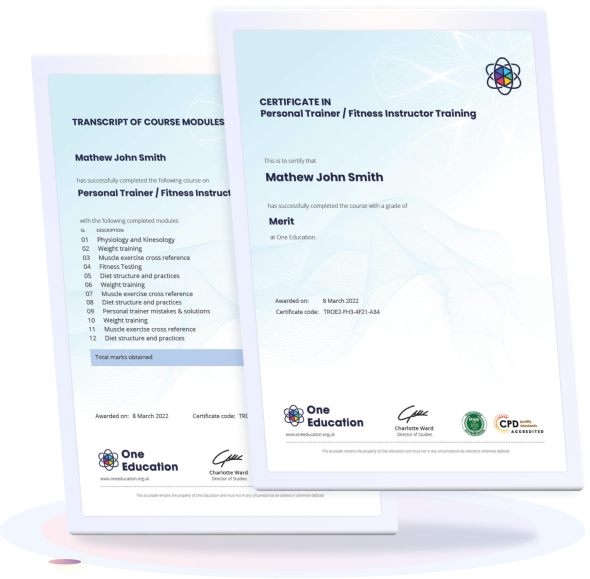
one education Certificate

After completing the Getting Results with PowerBI assessments, learners qualify for a CPD QS accredited certificate from One Education.

The certificate is available in two formats: a PDF version for £9 or a printed hard copy delivered by post for £15.

Why Study This Getting Results with PowerBI Course?

Studying a course based on Getting Results with Power BI helps learners build strong data analysis and visualisation skills. It enables professionals to transform raw data into actionable insights, supporting smarter business decisions across industries and roles.

This learning pathway enhances employability by equipping individuals with in-demand business intelligence capabilities. It supports career growth in analytics, reporting, and strategy roles while improving confidence in using data-driven tools to solve real-world organisational challenges effectively.

Course Duration

The Getting Results with PowerBI course has a total study time of 1 hour 15 minutes. Learners can progress through the material at a comfortable pace, allowing them to complete the course in a flexible way that fits their individual schedule and availability.

Requirements

The Getting Results with PowerBI course requirements are straightforward and accessible. Learners should have basic computer literacy, familiarity with spreadsheets, and an interest in data analysis. The course is fully online, requiring only an internet-enabled device, allowing participants to learn flexibly at their own pace from anywhere.

Career Path

Frequently Asked Questions

It teaches how to analyse data and create interactive dashboards using Power BI.

It is for beginners, business professionals, and anyone working with data.

You will learn data visualisation, reports, dashboards, and basic data modelling.

No, the course is suitable for beginners.

It usually takes a few hours to a few weeks depending on depth.

You can work as a data analyst, reporting analyst, or business intelligence assistant.

Course Curriculum

Getting Results with PowerBI
Module 01: Tour of the screen 00:04:00
Module 02: Pulling in your data from different sources 00:12:00
Module 03: Creating your first Visual 00:09:00
Module 04: Building a visual from 2 tables 00:08:00
Module 05: Slicers 00:07:00
Module 06: Making a Combo Chart Visual 00:06:00
Module 07: Using PowerQuery to restructure the data 00:04:00
Module 08: Creating Map Visuals 00:03:00
Module 09: Creating a report by Year, Qtr, or Month 00:04:00
Module 10: Calculating % of total 00:02:00
Module 11: Creating your own Calculation 00:05:00
Module 12: Decomposition Tree Visual 00:02:00
Module 13: Pulling it all together 00:09:00
Assignment
Assignment – Getting Results with PowerBI 00:00:00
top
Home Courses Search