Technical Analysis: Trading with RSI Indicator in 2021

Learn technical analysis using the RSI indicator to identify trends, momentum shifts, and entry signals. Build confident trading strategies, manage risks effectively, and improve market timing in dynamic conditions today.

Technical Analysis: Trading with RSI Indicator in 2021
cpdacree aoth ukrlp 24hs fullonline 14days

Get access to 5000+ courses including this for only £49. Learn More.

Overview of Technical Analysis: Trading with RSI Indicator in 2021

Technical Analysis: Trading with RSI Indicator in 2021 introduces learners to practical Technical Analysis techniques using the RSI Indicator. You will explore RSI fundamentals, understand momentum movements, and develop essential Market Analysis and Price Analysis skills. The course explains how traders can interpret market conditions and identify useful Trading Signals for more informed trading decisions.

Develop your RSI Trading knowledge by learning how to combine moving averages with RSI for both simple and advanced approaches. You will explore practical Trading Strategy methods using TradingView, recognise potential market opportunities, and understand how momentum influences price behaviour. These techniques support stronger Momentum Trading skills and help learners analyse changing market conditions with greater confidence.

The course also explores an effective RSI Strategy for long-term trading and investing, alongside regular and hidden divergences. You will learn how RSI divergence can support Financial Trading, identify possible trend changes, and strengthen decision-making. By completing the training, you can build practical technical analysis skills applicable to different trading approaches and market environments.

The course was audited and updated on: 15th August, 2026

Learning Outcomes of Technical Analysis: Trading with RSI Indicator in 2021

Method Of Assessment​

Learners complete an assignment designed to evaluate their understanding of the course content. The assignment is reviewed by qualified tutors who provide personalised feedback, allowing learners to demonstrate their applied knowledge and skills.

Certification

one education Certificate

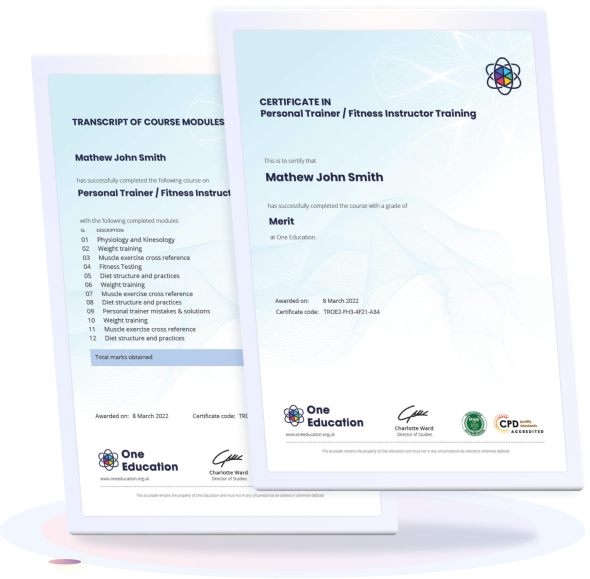
After completing the Technical Analysis: Trading with RSI Indicator in 2021 course assessment, you will be eligible to receive a CPD-accredited certificate worth £9 from One Education to demonstrate your achievement.

The certificate is also available as a printed hard copy delivered by post for £15.

Why Study This Technical Analysis: Trading with RSI Indicator in 2021 Course?

Technical analysis helps traders interpret market movements and identify potential trading opportunities. This course develops your understanding of the RSI Indicator, price analysis, momentum trading and trading signals, helping you make more informed observations when analysing financial markets.

Learning effective RSI Trading techniques can strengthen your approach to both short-term and long-term market analysis. You will explore moving averages, divergences and RSI Strategy methods, building valuable technical skills for developing and evaluating a structured Trading Strategy.

Course Duration

The Technical Analysis: Trading with RSI Indicator in 2021 Course has a total study time of 2 hours and 7 minutes. Learners can progress through the lessons at their own pace, allowing them to develop practical RSI trading and technical analysis knowledge while studying around their existing commitments.

Requirements

The Technical Analysis: Trading with RSI Indicator in 2021 course requires no advanced trading experience, making it accessible to beginners. Learners should have basic knowledge of financial markets, an interest in technical analysis and trading strategies, and access to an internet-enabled device to follow the lessons and practise RSI techniques.

Career Path

Frequently Asked Questions

What is the RSI indicator in technical analysis?
The Relative Strength Index (RSI) is a momentum indicator that measures the speed and strength of recent price movements on a scale from 0 to 100.

How is RSI used in trading?
Traders use RSI to assess market momentum, identify possible overbought or oversold conditions and support decisions about potential market entries or exits.

What do RSI levels of 70 and 30 mean?
An RSI reading above 70 is commonly considered overbought, while a reading below 30 is generally considered oversold. However, these readings should not be treated as guaranteed reversal signals.

What is RSI divergence?
RSI divergence occurs when price movement and the RSI indicator move in different directions. Traders often analyse regular and hidden divergences to identify possible changes or continuation in market momentum.

Can RSI be used for long-term trading?
Yes. RSI can be applied across different timeframes, including longer-term trading and investing, to analyse momentum, market trends and potential trading opportunities.

Should RSI be used on its own?
RSI is generally more useful when combined with other technical analysis methods, such as moving averages, support and resistance, price action or broader trend analysis.

Course Curriculum

Technical Analysis: Trading with RSI Indicator in 2021
Module 01: Follow This Steps for Effective Learning 00:32:00
Module 02: Introduction to RSI 00:04:00
Module 03: How to Add Moving Averages on RSI Indicator in Trading View 00:07:00
Module 04: Moving Averages on RSI Simple Trading Strategy 00:18:00
Module 05: Moving Averages on RSI Advanced Trading Strategy 00:14:00
Module 06: RSI Strategy for Long Term Trading and Investing 00:19:00
Module 07: Regular Divergences and How to Trade Them with RSI 00:18:00
Module 08: Hidden Divergences (The Secret One) and How to Trade Them with RSI 00:15:00
Assignment
Assignment – Technical Analysis: Trading with RSI Indicator in 2021 00:00:00
Technical Analysis: Trading with RSI Indicator in 2021
top