Filters can be as simple as checking a few boxes or as advanced as applying custom rules. Excel also supports tools like Advanced Filter and AutoFilter for more precise control. With similar filtering features available across Microsoft platforms like Access and Power Apps, understanding how to use them effectively is a key skill for working smarter with data.
Did you know that mastering Excel can increase your productivity by 40%? In 2026, Excel remains indispensable in the modern workplace. Possessing Microsoft Excel skills has become one of the most must-have strengths of our lives. Microsoft first launched it in 1985, and initially, it was solely used for business purposes. But, with the advancement of time, it has become so widespread that we use MS Excel almost every aspect of life, whether educational, official, business or even personal purposes.
After Excel, many computer programs have developed. But till today, it doesn’t lose the appeal at all, besides its popularity is bumping up day by day! So, you see, it is crucial to have Excel skills to rise in any professional field. However, follow the blog to vanquish 20 most obvious Excel skills for professionals.
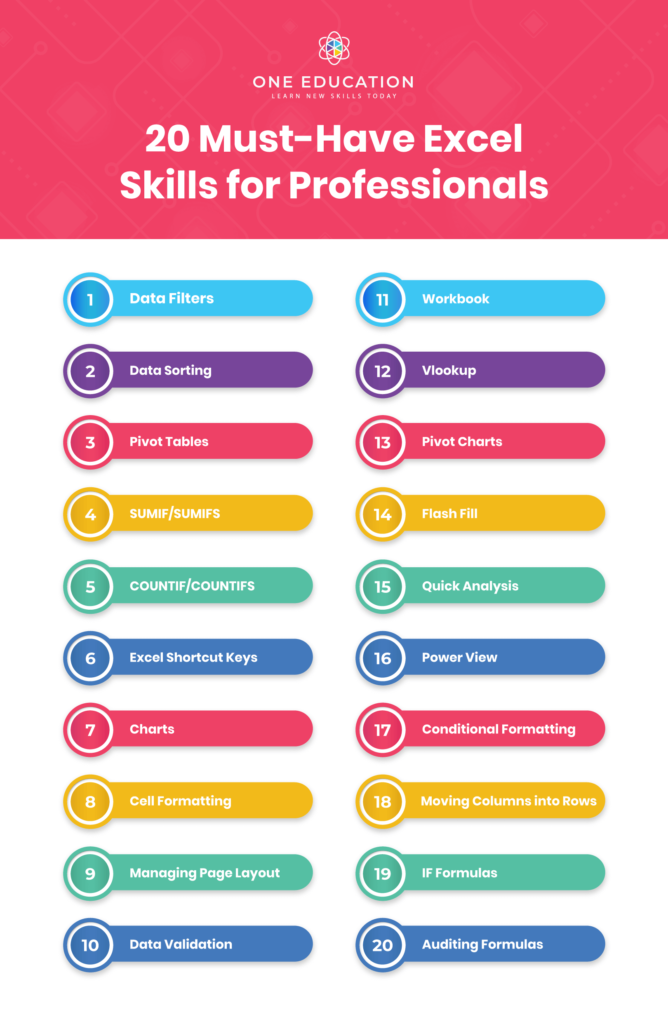
20 Basic Excel Skills Every Professional Should Know
You probably think that which excel skills you should acquire first as there are plenty of them. Well, for your ease, I’ve filtered out 20 must-have data management abilities for professional purpose. These basic Excel skills, including data sorting and pivot tables, are essential for daily tasks.
1. Data Filters
Data filters in Microsoft Excel are essential for managing and analyzing large datasets efficiently. They allow users to display only the rows that meet specific criteria, hiding the rest. This makes it easier to focus on relevant data—whether you’re filtering by value, range, or condition—to quickly uncover insights like high-performing products or regional trends.
2. Data Sorting
Sorting data in Excel is a key feature that helps organize information in a clear and meaningful way. Whether you’re working with names, numbers, or dates, Excel allows you to sort data alphabetically, numerically, or chronologically. You can sort by a single column or apply multi-level sorting, and even organize based on cell color, font color, or icons for added clarity.
However, accurate sorting requires more than just a few clicks. It’s important to select the full data range—especially when working with related columns—to prevent misalignment. Excel’s built-in sorting tools, including options for complex, layered sorting, make it easy to maintain structure while analyzing data efficiently.
3. Pivot Tables
Pivot Tables in Excel are powerful tools that let you summarize, analyze, and explore large datasets efficiently. They allow for quick calculations such as sums, averages, and counts, helping users spot trends and gain insights from raw data. Rearranging fields into rows, columns, filters, and values provides flexibility in how information is viewed.
PivotTables support features like slicers for easy filtering and PivotCharts for visual representation of summarized data. This makes them ideal for creating clear, interactive business reports and simplifying complex data analysis.
4. SUMIF/SUMIFS
The SUMIFS function in Excel allows you to sum values based on multiple criteria at once. For example, you can total sales where the product category is “Electronics” and the sales date falls within a specific month. This function enhances data analysis by handling several conditions simultaneously, making it useful for working with complex datasets.
5. COUNTIF/COUNTIFS
The COUNTIF and COUNTIFS functions in Microsoft Excel are essential tools for counting cells that meet specific criteria. COUNTIF handles a single condition, such as counting how many cells contain values greater than 5, while COUNTIFS extends this capability by allowing multiple conditions across one or more ranges—for example, counting sales above $1,000 in a certain region. These functions help automate data analysis and reduce errors in large datasets.
If you’re new to these functions, learning to use them effectively can greatly improve your efficiency with Excel. A structured approach, such as following a dedicated Excel course or tutorial, can help you master COUNTIF and COUNTIFS quickly, making it easier to perform complex data filtering and reporting tasks with confidence.
6. Excel Shortcut Keys
Mastering Excel shortcut keys can greatly enhance your efficiency by letting you perform common tasks quickly without relying on the mouse. For example, shortcuts like Ctrl+C to copy, Ctrl+V to paste, and Ctrl+Z to undo speed up everyday actions, while Ctrl+1 opens the Format Cells dialog to quickly adjust formatting.
While each shortcut saves only a few seconds, the cumulative effect over a workday is significant, especially for professionals working with spreadsheets frequently. Learning these shortcuts is a simple way to streamline workflow and improve productivity in Excel.
7. Charts
Creating charts is an essential Excel skill that allows professionals to present data visually and effectively. For instance, using VLOOKUP to collate sales data and then showcasing it through bar or pie charts simplifies complex datasets for better decision-making. In today’s data-driven landscape, the ability to create clear and impactful charts is highly valued by employers and can enhance your analytical presentations.
8. Cell Formatting
Cell formatting in Excel is a crucial skill that helps users customize the appearance and readability of their spreadsheets. For example, changing fonts, colors, and number formats can make data easier to interpret and highlight important information. Using features like borders, alignment, and fill colors, professionals can create well-organized and visually appealing worksheets.
Mastering cell formatting also streamlines data presentation and enhances clarity in reports. Applying consistent styles or using the Format Cells dialog allows for precise control over how data appears. This skill is highly valued as it improves efficiency and ensures that complex data is communicated clearly and effectively.
9. Managing Page Layout
Managing the page layout in Excel is essential for creating professional, print-ready spreadsheets. Adjusting settings such as margins, orientation, paper size, headers and footers, and scaling ensures that your content fits neatly on the page and looks polished. These features help control how your worksheet appears when printed or shared, improving readability and presentation.
For example, setting custom margins and page breaks allows you to print financial reports with proper alignment and clear sections. Mastering page layout not only enhances the visual appeal of your documents but also boosts efficiency by reducing wasted paper and avoiding formatting errors, leaving a strong impression in any business environment.
10. Data Validation
Data Validation is a feature in Excel that controls what can be entered into a cell or range of cells. For example, it can restrict entries to whole numbers within a certain range, dates within a specific period, or selections from a predefined list. This helps improve data accuracy and consistency by preventing invalid or incorrect data from being entered.
This tool also provides feedback by displaying input messages and error alerts to guide users during data entry. Data Validation is useful for maintaining data integrity, reducing errors, and streamlining data entry in spreadsheets, making your work more reliable and easier to manage.
11. Workbook
Excel workbooks are single files that contain one or more worksheets, which are individual spreadsheets used to organize and analyze data. For example, a company might keep sales, expenses, and forecasts on separate sheets within the same workbook, making it easier to manage related information in one place. This organization helps users navigate complex data more efficiently.
Opening Excel automatically creates a new workbook, and users can also start workbooks from templates or blank files. Workbooks are saved with the .xlsx file format by default. Mastering how to create and manage workbooks is a basic but essential skill, especially in entry-level roles where organizing data clearly is important for daily tasks and reporting.
12. Vlookup
VLOOKUP is a core Excel function that anyone working with data should know. It allows users to search for specific information in one column and return related data from another, making it perfect for combining datasets and creating comprehensive reports.
This essential tool is especially useful for analysts and professionals in data-driven roles, helping streamline workflows and reduce manual errors. As data analysis becomes more critical across industries, mastering VLOOKUP remains a valuable asset.
13. Pivot Charts
Pivot Charts in Excel provide a visual, interactive way to explore and understand summarized data from PivotTables. They allow users to filter and sort data directly within the chart, offering quick insights—for example, identifying sales trends by product category or region. Unlike standard charts, Pivot Charts update dynamically as the underlying PivotTable changes.
This makes Pivot Charts especially useful for professionals who need flexible and insightful reporting tools. With features like customizable chart types and built-in filters, they simplify complex datasets and support better, faster decision-making.
14. Flash Fill
Flash Fill is a smart Excel feature that detects patterns in your data entry and automatically completes the rest. For instance, when separating first and last names or standardizing phone number formats, Flash Fill instantly fills in the remaining values once it recognizes a consistent input pattern.
This tool is ideal for simplifying repetitive tasks and minimizing manual errors when working with structured data. Flash Fill enhances productivity by quickly transforming and organizing data without complex formulas or functions.
15. Quick Analysis
The Quick Analysis tool in Excel is a powerful feature that lets you instantly apply formatting, create charts, calculate totals, and more—just by selecting your data. It’s perfect for quickly spotting trends or summarizing information without needing advanced Excel knowledge.
This essential Excel skill is also a time-saver; it reduces the effort needed to analyze or visualize data by offering one-click options. You’ll learn more about how to use it effectively in an Excel training course, but for now, just know it helps you work faster and smarter!
16. Power View
Power View is a dynamic Excel feature designed for data visualization and interactive reporting. It enables users to create engaging charts, graphs, maps, and dashboards, offering a visual approach to data exploration. This tool supports real-time insights and encourages intuitive, ad-hoc analysis without complex setup, making it accessible for users at all levels.
Professionals often use Power View to build interactive reports that highlight key trends and metrics, ideal for presentations or executive summaries. With the ability to filter, drill down, and animate visuals like scatter plots, it simplifies complex datasets into clear, presentation-ready formats—enhancing both understanding and decision-making.
17. Conditional Formatting
Knowing how to use Excel’s conditional formatting helps you highlight trends, patterns, or key data points instantly. With Excel’s conditional formatting options like color scales, data bars, and icon sets, you can transform plain datasets into visual insights that are easier to interpret.
Excel’s conditional formatting offers a wide range of built-in rules and lets you create custom ones using formulas, making it endlessly adaptable. Mastering this feature is essential to stand out with the most in-demand Excel skills of 2025.
18. Moving Columns into Rows
Moving columns into rows in Excel is an essential skill for reorganizing data to fit specific analysis or presentation needs. This process, often called transposing, lets you switch the orientation of data between columns and rows without manually retyping it.
For example, you can use the ‘Transpose’ option found under the Paste Special menu to quickly convert a column of data into a row or vice versa. Mastering this technique helps keep spreadsheets organized and saves time when adjusting data layouts for reports or further calculations.
19. IF Formulas
The IF formula in Excel allows users to perform logical tests, returning one result if the condition is true and another if it is false. For example, you can use =IF(A1>10, “Greater than 10”, “Not greater than 10”) to check if a value exceeds 10 and display a message accordingly. Nested IF statements and combinations with AND, OR, and NOT functions enable more complex decision-making within spreadsheets.
For instance, =IF(AND(A1>10, B1<5), “Valid”, “Invalid”) checks multiple conditions before returning a result. The IFS function further simplifies handling multiple conditions by evaluating them sequentially. These formulas enhance the ability to automate decisions and improve data analysis accuracy in Excel.
20. Auditing Formulas
Formula auditing in Excel is a powerful feature that helps users visualize the relationships between formulas and cells, making it easier to identify errors or inconsistencies. Key tools like ‘Trace Precedents’ and ‘Trace Dependents’ highlight which cells affect or are affected by a formula, while options such as ‘Evaluate Formula’ and ‘Error Checking’ allow step-by-step debugging and automatic detection of common mistakes.
For example, when reviewing complex financial spreadsheets, formula auditing ensures calculations are accurate and consistent across linked data. Although it may seem advanced at first, mastering these tools is straightforward and greatly improves spreadsheet reliability and troubleshooting efficiency.
If you want to explore some of the above-mentioned skills, watch the video below.
Want to advance your employment opportunities? Excel Course is a must!
Conclusion
The excel skills featured above are commonly sought after when employers are looking to fill roles as a Personal Assistant, Admin Assistant and other entry-level job roles such as a Bookkeeper or Project Manager. Which means that it makes sense if you want to enhance your opportunities for employment and Excel Course is a must!
Excel is one of the best software programs out there and is a standard requirement in most businesses for that reason. If you are new to Excel or already experience, there will always something new to learn. You’ll never get bored when working with excel but you’ll frequently be delighted Excels power and with what you learn about it.
FAQs
What to learn in excel?
Learn essential Excel skills for professionals:
1. Data analysis techniques.
2. Formulas and functions.
3. PivotTables for summarizing data.
4. Data visualization using charts.
5. Conditional formatting for highlighting key information.
6. VLOOKUP and HLOOKUP for data retrieval.
7. Macros for automating repetitive tasks.
8. Spreadsheet auditing tools for error-checking.
9. Collaboration features like sharing and tracking changes.
10. Advanced techniques such as goal seek and scenario analysis.
What Excel skills do employers value most in 2026?
Employers seek professionals proficient in Excel with skills such as data analysis, formulas, functions, pivot tables, and VBA macros.
What are basic excel skills?
Basic Excel skills include formatting cells, creating basic formulas, sorting and filtering data, and understanding basic functions like SUM, AVERAGE, and IF.
What excel skills are required for mis executive?
For MIS executives, essential Excel skills include data analysis, pivot tables, VLOOKUP, IF functions, and chart creation.
Wow to improve excel skills?
Improve Excel skills by practicing regularly with various functions, formulas, and shortcuts. Explore online tutorials and courses to learn new techniques. Additionally, seek opportunities to apply Excel in your work to gain practical experience and efficiency.
What are advanced excel skills?
Advanced Excel skills include data analysis, visualization, automation, and advanced formulas. These skills enable professionals to manipulate data efficiently, create insightful reports, and automate tasks, enhancing productivity and decision-making.
What to learn in excel for job?
In Excel, professionals should learn essential skills such as data entry, formatting, and basic formulas. They should also understand functions like VLOOKUP, IF, and SUMIF for data analysis. Additionally, mastering PivotTables, charts, and graphs can enhance data visualization capabilities. Finally, proficiency in macros and automation can streamline repetitive tasks and improve efficiency in Excel usage for job-related tasks.
Related Articles
Get a FREE Course
- Learn useful skills online free
- Get CPD accredited certificate
- Add it to your CV today!

Aug, 14, 2025