In today’s hyper-competitive business market, if you want to take business value to the next level, you need a solid understanding of where you are, what you want to achieve, and what’s possible.
And if you want to make data-driven decisions, it requires leveraging Business Intelligence to gather and analyse data, uncovering valuable insights. It helps you to make the optimal decisions for your business.
Keep reading the article to know how Business Intelligence turns raw data into insight and helps you make a perfect decision to grow your business.
What is Business Intelligence?
Business Intelligence (BI) systems have become increasingly popular in recent years due to the growth of data collection and storage capabilities. BI systems can process raw data and convert it into actionable insights, allowing organisations to make smarter, more informed decisions.
It can impact business performance in a powerful value proposition. So, Business Intelligence is all about harnessing the data, analysing and visualising the data, and finally providing valuable insight to make a data-driven smart decision.
How does Business Intelligence work?
Theoretically, the three-stage of Business Intelligence is straightforward but has many challenges in practice. So, let’s go deeper and understand these three areas and combine how they help you make a data-driven decision.
Data
In today’s modern world, companies generate a ton of data. According to the World Economic Forum, it is estimated that 463 exabytes of data will be produced daily by 2025, equivalent to 212,765,857 DVDs a day.
In the online age, businesses have things like social media and cloud base business services which makes tons of data along with on-premise databases. There lies the biggest challenge for Business Intelligence.
All the data isn’t in a single database, making it hard to get a 360 view of your business’s performance without looking at multiple reports on different platforms.
We need to bring those disparate data sources together and analyse them to get a clear picture of your business performance.
Analyse
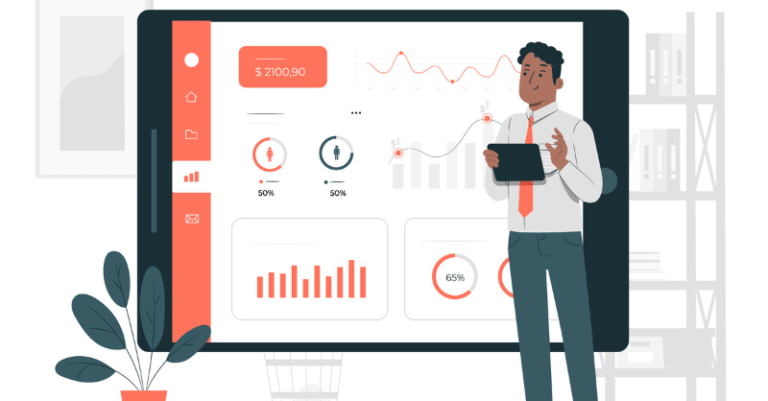
The analysis is usually a form of reports and dashboards containing a visual representation of the aggregate data. The analytic dashboard contains your business metrics and KPIs (Key Performance Indicators), such as your revenues, stock levels or the engagement you get from social media.
When tracking and benchmarking your KPIs, you can measure your business performance. Visualising your data using BI makes it easy to read, understand and digest. Effective visualisation is the key to understanding the data.
The Business Intelligence dashboard provides you with an at-a-glance snapshot of overall performance. It helps you know where you are doing well and where you need to provide more attention to boost your business.
Insight
Once all the data has been gathered, analysed, and visualised, it’s time to move into the insights stage. After inspecting the analysis, identify what can be learned from it.
The insight assists in monitoring trends, examining metrics correlations, and comparing performance across different timeframes. By combining all of the data, an overview can be created to determine where investments should be made and which areas should be focused on to make an informed decision.
How to get started with Business Intelligence?
A Business Intelligence system helps you to get interactive insights into your organisation to improve your business performance. If you want to apply BI to your business, here are some steps to help you start.

Involve Everyone
When you implement Business intelligence, your employees should clearly know what you are going to do. Also, you can include them in your team to give them a better idea of Business Intelligence policies and implementation.
Choose the Right Tools
You should clearly know what suits your business. Also, set an expectation of what you want from Business Intelligence. Then, choose BI tools that are compatible with your business. You should select software that integrates with other systems you already use and is compatible with your existing tech stack.
Create an Analytical Framework
You should make an analytical framework about what you want to track, like goals, metrics and KPIs. The framework should be a representation of your business objection. So, before going forward, take some time to organise it properly.
Data Collection and Organisation
Then, collect all of the data your business produces from different platforms. As most businesses have an online presence, ETL, transforming, and loading can help you get data.
The data you are collecting should be accurate and up to date. The data you are gathering should be clean to get a better outcome from the software, as output depends on your entering data.
Data Analysis
After collecting and organising the data, start finding the trends or patterns of those data. You can do this process manually or using tools. Your goal is to find out actionable insights.
Data Visualisation
After analysing, you should represent the found data in a way that is easy to understand. Depending on your business model, you can do this in various ways, like graphs, charts, infographics, and tables.
Take Action
Now, it is time to identify meaningful insights through your analysis. Provide a close look and find out what you should do to improve your business. It might be introducing new services, campaigns, new pricing or changing existing services based on the data you organised.
Benefits of Using Business Intelligence Systems
Business Intelligence is a holistic initiative to use data in an organised way in business operations, making it more than just software. Here are some benefits of Business Intelligence:
- Data-driven smart business decision
- Fastest data sourcing and analysing
- Decreased costs
- Increased profitability
- Help to benchmark performance against the competitor organisation
- Improve customer satisfaction
Final Words
Business intelligence will be a perfect tool for you to make data-driven decisions. However, you must be prepared to face several obstacles when applying BI to your business. These obstacles include the need for reliable data sources and specialised software.
If you can overcome these obstacles, you can uncover hidden trends and patterns and better understand the competitive landscape, which will help you to boost your business.


 September 19, 2023


