Math isn’t just about solving for x or finding the value of y. It’s also about understanding the numbers around us, the patterns they form, and what those patterns mean. That’s where statistical measures like mode, modal, and mean come into play. If you’re scratching your head wondering what all these terms mean and why you should care, don’t worry—you’re not alone.
What is the Modal in Maths?
The word modal refers to something concerning or related to the mode. It’s used to describe the value that appears most frequently in a set of data. So, if we are talking about a modal number in a list of test scores, we mean the number that shows up more than any other. It’s like the most popular kid in school standing out because it occurs the most.
Functional Skills Maths Level 2: Maths Magic
What is the Difference Between Mode, Median, and Mean?
These three terms are all measures of central tendency. They tell us different things about our data, though. Let’s break them down.
What is Mode?
The mode is the most frequently occurring value in a set, akin to the life of the party that everyone is drawn to. In a dataset, if a particular number keeps popping up more often than the others, that’s your mode.
What is Median?
The median is the middle value in a list when all the numbers are arranged in order. It’s like the kid who stands right in the middle when the class lines up by height. If there’s an even number of values, the median is the average of the two middle numbers.
How to Find It:
1. Arrange the numbers in ascending order.
2. If there’s an odd number of values, the middle one is your median.
3. If there’s an even number, add the two middle values and divide by two.
Example:
For the list 5, 10, 15, 20, and 25, the median is 15 (right in the middle). If we add another number, say 30, then the median would be the average of 15 and 20, which is 17.5.
What is Mean?
The mean is what most people think of as the average. You get it by adding up all the values in a data set and then dividing by the number of values. It’s like splitting a pizza into equal slices for everyone.
How to Calculate It:
Add all the numbers together, then divide by how many numbers there are.
Example:
For the numbers 4, 8, and 12, the mean would be (4 + 8 + 12) ÷ 3 = 24 ÷ 3 = 8.
How Modal Differs from Mode, Median, and Mean?
Now, back to modal. While the mode tells you which number occurs the most, modal is just a term describing the characteristics related to the mode. It’s not a separate calculation but more about the quality of a data set having a mode.
How to Calculate Mode, Median, and Mean in Maths?
Calculating mode, median, and mean involves distinct steps tailored to your data set. To find the mode, identify the number that appears most frequently. For the median, first arrange the numbers in ascending order and then pinpoint the middle value; if there’s an even number of entries, average the two middle numbers. The mean requires adding all the values together and dividing by the total count of numbers. Each method provides unique insights into the data’s central tendency, helping you understand its distribution better.
How to Calculating the Mode?
Finding the mode involves listing all the numbers in your data set. After that, count how many times each number appears. The number that occurs most frequently is the mode. If multiple numbers share this highest count, the data set is considered bimodal or multimodal, indicating it has more than one mode.
To find the mode:
1. List all the values in your data set.
2. Count how many times each value occurs.
3. The value that occurs the most often is the mode.
Example:
If you have the numbers 2, 2, 5, 6, 7, and 8, the mode is 2 because it appears three times, more than any other number.
How to Calculating the Median?
Finding the median involves a few straightforward steps. First, you need to arrange your data set in ascending order, which means sorting the numbers from the smallest to the largest. Once the numbers are lined up, you can pinpoint the median by identifying the middle value. If your list contains an odd number of entries, the median is simply the value right in the center.
However, if there’s an even number of entries, you will need to take the average of the two middle numbers to find the median accurately. This process ensures that the median reflects the central tendency of your data set effectively.
To find the median:
1. Arrange the data in numerical order.
2. Identify the middle value (or the average of the two middle values).
Odd number of data points: The middle value is the median.
Even number of data points: The median is the average of the two middle values.
Example:
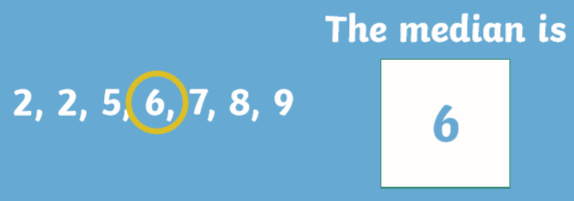
For the numbers 2, 2, 5, 6, 7, 8, and 9 the median is 6.
How to Calculating the Mean?
Calculating the mean requires two steps. First, add all the values in your data set to get the total sum. Then, divide this sum by the number of values. This average, or mean, summarizes the data set, giving you a clear idea of its central tendency and overall trend.
To find the mean:
1. Add all the values together.
2. Divide the sum by the total number of values.
Example:
For the data set 2, 2, 5, 6, 7, and 8 the mean is (2+2+5+6+7+8) ÷ 6 = 30 ÷ 6 = 5.
FAQ
What is the modal class in grouped data?
The modal class is the interval in a grouped frequency distribution that contains the most data points. It’s essentially the mode for grouped data.
Can a data set have more than one mode?
Yes, a data set can be bimodal (two modes) or multimodal (more than two modes) if multiple values occur with the same highest frequency.
What is the difference between unimodal and bimodal distributions?
A unimodal distribution has one mode, while a bimodal distribution has two modes.
How do mean and median compare when data is skewed?
In a skewed distribution, the mean gets pulled towards the tail, while the median stays closer to the middle of the data set.
Why is the median sometimes a better measure of central tendency than the mean?
The median is less affected by extreme values, making it a better indicator of central tendency in skewed distributions.
Conclusion
The mode, modal, median, and mean, broken down into digestible chunks. Whether you’re crunching numbers in a math class or trying to make sense of data in the real world, knowing how to calculate and differentiate these terms is super useful.